
|
|
|
| [Science] [BAS home] [Met home] [Beowulf home] | Antarctic Meteorology |
pp_plot_with_ttest,a,b,z=z,mask=mask,lf=0.25
pp_plot_with_ttest,a12,b12,z12=z12,mask=mask,lf=0.25
Areas of the field that are masked as sig at different levels of significance are:
sig level	area masked (JJA)    (DJF)
---------	-----------------    -----
50%             48.34%               36.53
90%		 7.76%                3.39
95%		 3.06%                1.18
99%		 0.78%                0.0006
The "real" answers should be 50, 10, 5 and 1%, of course. These are close enough I think.
JJA: 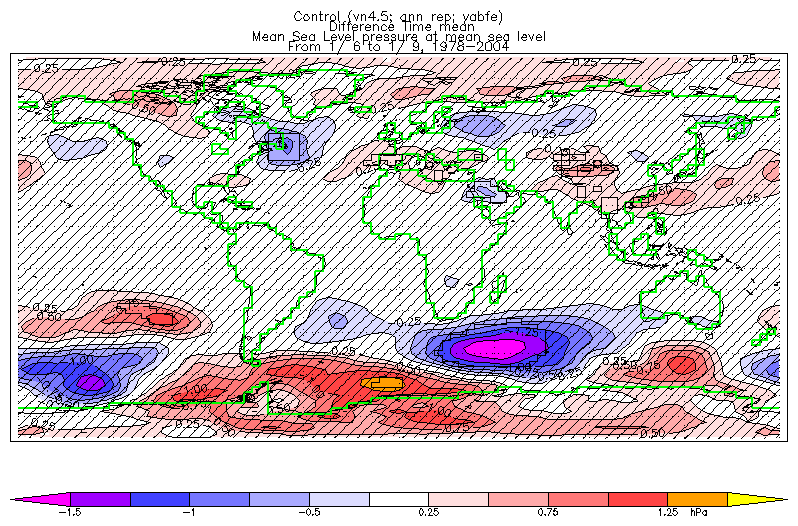 DJF:
DJF: 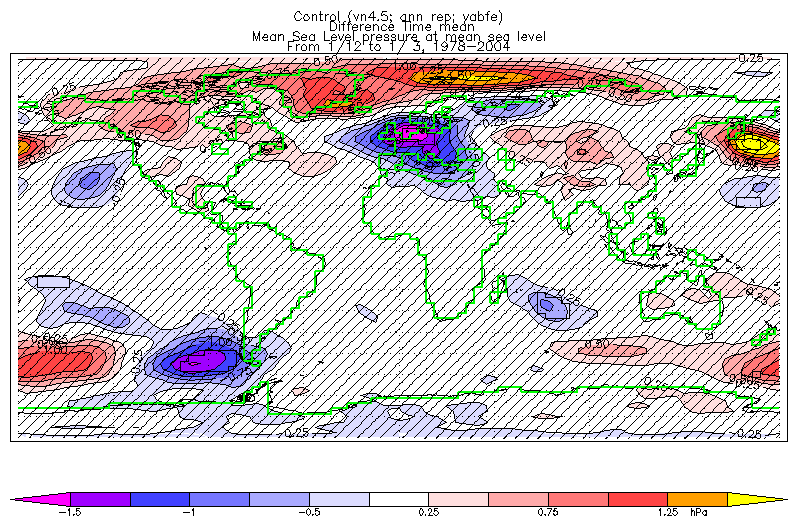
pp_plot_with_ttest,a,b,z=z,mask=mask,lf=0.25
print,pp_mask_fraction(pp_set_mask(z,'f1.data lt 0.01'))
gettwogifs,out='t300-jja'
sig level      area masked (JJA)   (DJF)
---------      -----------------   -----
50%            58.33%              67.72
90%            15.03%              35.86
95%             8.10%              29.82
99%             1.31%              18.31
For DJF, there is a rather large area declared "significant", but looking at the piccy the absolute differences are so small I challenge anyone to care...
JJA: 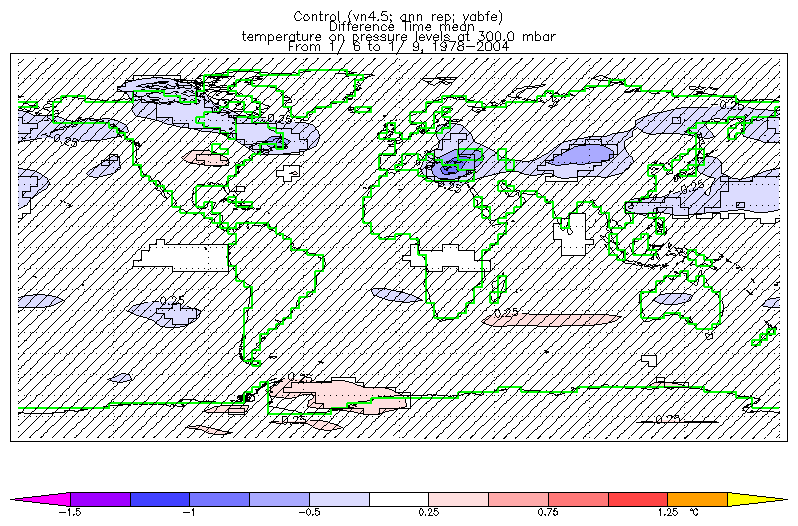 DJF:
DJF: 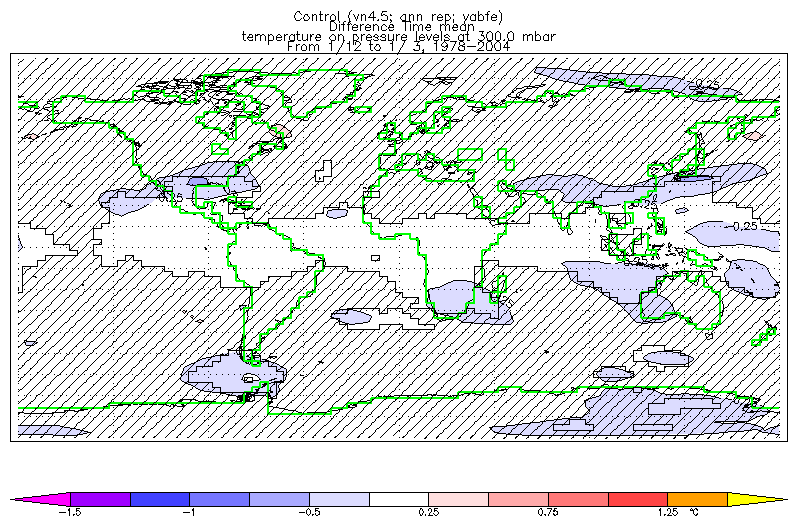
Years for JJA:
64:
        1978        1979        1980        1981        1982        1983        1984        1985        1986
        1987        1988        1989        1990        1991        1992        1993        1994        1995
        1996        1997        1998        1999        2000        2001        2002        2003        2004
32:
        1978        1979        1980        1981        1982        1983        1984        1985        1986
        1987        1988        1989        1990        1991        1992        1993        1994        1995
        1996        1997        1998        1999        2000        2001        2002        2003        2004
        2005        2006        2007        2008        2009        2010        2011        2012        2013
        2014        2015        2016        2017        2018        2019        2020        2021        2022
        2023        2024        2025
years for DJF:
64:
        1978        1979        1980        1981        1982        1983        1984        1985        1986
        1987        1988        1989        1990        1991        1992        1993        1994        1995
        1996        1997        1998        1999        2000        2001        2002        2003
32:
        1978        1979        1980        1981        1982        1983        1984        1985        1986
        1987        1988        1989        1990        1991        1992        1993        1994        1995
        1996        1997        1998        1999        2000        2001        2002        2003        2004
        2005        2006        2007        2008        2009        2010        2011        2012        2013
        2014        2015        2016        2017        2018        2019        2020        2021        2022
        2023        2024
| Past last modified: 24/6/2002 / wmc@bas.ac.uk |
© Copyright Natural Environment Research Council - British Antarctic Survey 2001 |